| Latest News from Moneycontrol.com |
Thursday, January 25, 2007
monetary policy transmission and corporate behavior
I am currently reviewing literature on relationship between corporate finance and monetary policy transmission. By corporate finance I mean the investment pattern of firms within a particular industry or size and their capital structure.
Credit channel theories explain the phenomenon via bank lending and balance sheet channel. An extension to the balance sheet channel was the broad channel of credit policy.
Observing the captial structure of Indian manufacturing firms one can conclude there is very little choice with firms to raise funds from untlil very recently.
Monday, November 20, 2006
Insurance is not an Investment or should be looked upon as a tax saving tool
I happen to pick up "Outlook Money" Nov.30, 2006 issue which had the cover story featuring the need for an insurance and types of insurance policies.
The story highlighting the importance of an insurance policy reminded of my conversation with a professor working with IIM Indore. He contended that the
insurance policy has bee sold in India on a wrong premise with agents pushing for endowment schemes which were not only costly for the individual but also
offered limited cover.
With the incoming of private insurance companies enetring the Indian market and introducting wide alternative schemes both under the endowment and term
insurance lead, there has been some change in the perception of Indians towards the concept of insurance and its importance.
My view is that first insurance policy to be bought should be a term insurance. This offers you maximum coverage at least cost. For instance annual premium
of Rs.3000 for 10 years can fetch you a coverage of Rs. 10 lakhs during the period.
Tuesday, October 31, 2006
RBI credit policy - Oct. 31, 2006
Key Highlights
- Repo Rate increased to 7.25% from 7.0 %
- Reverse Repo Rate, Bank Rate & Cash reserve ratio (CRR) kept unchanged
- To conduct overnight repo or longer-term repo including the right to accept or reject tender(s)under the LAF
- Repo Rate increased to 7.25% from 7.0 %
- Reverse Repo Rate, Bank Rate & Cash reserve ratio (CRR) kept unchanged
- To conduct overnight repo or longer-term repo including the right to accept or reject tender(s)under the LAF
Wednesday, October 04, 2006
Reading list on Theories of Capital Structure
I. MM Propositions and Trade-off Theory
☆ 1. RWJ Chapter 15 and 16 (or BM Chapter 18)
☆ 2. Miller, Merton, 1988, "The Modigliani-Miller Propositions after Thirty Years," Journal
of Economic Perspectives, 2, 99-120.
☆ 3. Berens, James L., and Charles J. Cuny, 1995, "The Capital Structure Puzzle Revisited,"
Review of Financial Studies, 8, 1185-1208.
4. DeAngelo, Harry and Ronald Masulis, 1980, “Optimal Capital Structure Under
Corporate and Personal Taxation,” Journal of Financial Economics, 8, 3-30.
5. Fama, Eugene F., and Kenneth R. French, 1998, “Taxes, Financing Decisions, and
Firm Value,” Journal of Finance, 53, 819-843.
△ 6. Graham, John R., 2000, “How Big Are the Tax Benefits of Debt,” Journal of Finance,
55, 1901-1941.
II. Capital Structure: Information Asymmetry
☆ 1. Leland, Hayne, and David Pyle, 1977, "Information Asymmetries, Financial Structure,
and Financial Intermediation," Journal of Finance, 32, 371-387.
☆ 2. Myers, Stewart C., and Nicholas Majluf, 1984, "Corporate Financing and Investment
Decisions When Firms Have Information that Investors Do Not Have," Journal of
Financial Economics, 13, 187-222.
☆ 3. Myers, Stewart C., 1984, "The Capital Structure Puzzle," Journal of Finance, 39, 575-
592.
★ 4. Shyam-Sunder, Lakshmi, and Stewart C. Myers, 1999, "Testing Static Tradeoff against
Pecking Order Models of Capital Structure," Journal of Financial Economics, 51,
219-244.
Chirinko, Robert S., and Anuja R. Singha, 2000, " Testing static tradeoff against
pecking order models of capital structure: A critical comment," Journal of Financial
Economics, 58, 417-425.
Corporate Finance Seminar I National Taiwan University
Fall, 2001 Konan Chan
3
5. Akerlof, George, 1970, "The Market for ‘Lemons’: Quality Uncertainty and the Market
Mechanism," Quarterly Journal of Economics, 84, 488-500.
6. Ross, Stephen, 1977, "The Determinants of Financial Structure: The Incentive
Signalling Approach," Bell Journal of Economics, 8, 23-40.
III. Capital Structure: Agency Costs
☆ 1. Jensen, Michael, 1986, "Agency Costs of Free Cash Flow, Corporate Finance,
Takeovers," American Economic Review, 76, 323-29.
☆ 2. Harris, Milton, and Arthur Raviv, 1991, "The Theory of Capital Structure," Journal of
Finance, 46, 297-355.
★ 3. Rajan, Raghuram, and Luigi Zingales, 1995, "What Do We Know about Capital
Structure? Some Evidence from International Data," Journal of Finance, 50, 1421-
1460.
△ 4. Parrino, Robert, and Michael S. Weisbach, 1999, "Measuring Investment Distortions
Arising from Stockholder-Bondholder Conflicts," Journal of Financial Economics,
53, 3-42.
5. Jensen, Michael, and William Meckling, 1976, "Theory of the Firm: Managerial
Behavior, Agency Costs, and Ownership Structure," Journal of Financial Economics,
3, 305-360.
6. Myers, Stewart C., 1977, "The Determinants of Corporate Borrowing," Journal of
Financial Economics, 5, 146-175.
7. Myers, Stewart C., 1993, "Still Searching for Optimal Capital Structure," Journal of
Applied Corporate Finance, 6, 4-14.
IV. Interaction between Product Markets and Capital Structure
☆ 1. Brander, James A., and Tracy R. Lewis, 1986, "Oligopoly and Financial Structure,"
American Economic Review, 76, 956-970.
☆ 2. Maksimovic, Vojislav, and Sheridan Titman, 1991, "Financial Policy and Reputation
for Product Quality," Review of Financial Studies, 4, 175-200.
★ 3. Chevalier, Judith, 1995, "Do LBO Supermarkets Charge More? An Empirical Analysis
of the Effects of LBOs on Supermarket Pricing," Journal of Finance, 50, 1095-1112.
4. Titman, Sheridan, 1984, "The Effect of Capital Structure on a Firm's Liquidation
Decision," Journal of Financial Economics, 13, 137-152.
5. Phillips, Gordon M., 1995, "Increased Debt and Product Market Competition: An
Empirical Analysis," Journal of Financial Economics, 37, 189-238.
V. Payout Policy
Corporate Finance Seminar I National Taiwan University
Fall, 2001 Konan Chan
4
1. RWJ Chapter 18 (or BM Chapter 16)
☆ 2. Miller, Merton, and Kevin Rock, 1985, "Dividend Policy under Asymmetric
Information," Journal of Finance, 40, 1031-1052.
☆ 3. Bagwell, Laurie Simon, and John B. Shoven, 1989, "Cash Distributions to
Shareholders," Journal of Economics Perspectives, 3, 129-140.
★ 4. Ikenberry, David, Josef Lakonishok, and Theo Vermaelen 1995, "Market
Underreaction to Open Market Repurchases," Journal of Financial Economics, 39,
181-208.
△ 5. Fama, Eugene F., and Kenneth R. French, 2001, "Disappearing Dividends: Changing
Firm Characteristics or Lower Propensity to Pay," Journal of Financial Economics,
60, 3-43.
6. Stephens, Clifford P., and Michael S. Weisbach, 1998, "Actual Share Reacquisitions in
Open-Market Repurchase Programs," Journal of Finance, 53, 313-333.
7. Jagannathan, Murali, Clifford P. Stephens, and Michael S. Weisbach, 2000, "Financial
Flexibility and the Choice between Dividends and Stock Repurchases," Journal of
Financial Economics, 57, 355-384.
8. Chan, Konan, David Ikenberry, and Inmoo Lee, 2001, "Do Firms Knowingly
Repurchase Stock for Good Reason?" working paper.
VI. Initial Public Offerings
1. RWJ Chapter 19 (or BM Chapter 15)
☆ 2. Ritter, Jay R., 1998, "Initial Public Offerings," Contemporary Finance Digest, 2, 5-30.
☆ 3. Benveniste, Lawrence M, and Paul A. Spindt, 1989, "How Investment Bankers
Determine the Offer Price and Allocation of New Issues," Journal of Financial
Economics, 24, 343-361.
★ 4. Aggarwal, Reena, 2000, "Stabilization Activities by Underwriters after Initial Public
Offerings," Journal of Finance, 55, 1075-1103.
△ 5. Chen, Hsuan-Chi, and Jay R. Ritter, 2000, "The Seven Percent Solution," Journal of
Finance, 55, 1105-1131.
6. Teoh, Siew Hong, Ivo Welch, and T.J. Wong, 1998, "Earnings Management and the
Long-Run Market Performance of Initial Public Offerings," Journal of Finance, 53,
1935-1974.
7. Rock, Kevin, 1986, "Why New Issues Are Underpriced," Journal of Financial
Economics, 15, 187-212.
Corporate Finance Seminar I National Taiwan University
Fall, 2001 Konan Chan
5
8. Ritter, Jay R., 1991, "The Long-Run Performance of Initial Public Offerings," Journal
of Finance, 46, 3-27.
9. Brav, Alon, and Paul A. Gompers, 1997, "Myth or Reality? The Long-Run
Underperformance of Initial Public Offerings: Evidence from Venture and Nonventure
Capital-backed Companies," Journal of Finance, 52, 1791-1822.
10. Krigman, Laurie, Wayne H. Shaw and Kent L. Womack, 2001, "Why Do Firms
Switch Underwriters?" Journal of Financial Economics, 60, 245-284.
△ 11. Field, Laura C., and Gordon Hanka, 2001, "The Expiration of IPO Share Lockups,"
Journal of Finance, 56, 471-500.
VII. Security Offerings
☆ 1. Ritter, Jay R., 2002, "Investment Banking and Securities Issuance," Chapter 9 in
Constantinides, Milton and Stulz ed.: Handbook of the Economics of Finance
☆ 2. Stein, Jeremy C., 1989, "Efficient Capital Markets, Inefficient Firms: A Model of
Myopic Corporate Behavior," Quarterly Journal of Economics, 15, 655-669.
☆ 3. Lucas, Deborah J., and Robert McDonald, 1990, "Equity Issues and Stock Price
Dynamics," Journal of Finance, 45, 1019-1043.
★ 4. Alon Brav, Christopher Geczy, and Paul A. Gompers, 2000, "Is the Abnormal Return
Following Equity Issuances Anomalous? " Journal of Financial Economics, 56, 209-
249.
5. Loughran, Tim, and Jay R. Ritter, 1995, "The New Issues Puzzle," Journal of Finance,
50, 23-51.
6. Stein, Jeremy, 1992, "Convertible Bonds as Backdoor Equity Financing," Journal of
Financial Economics, 32, 3-21.
7. Lee, Inmoo, 1997, "Do Managers Knowingly Sell Overvalued Equity," Journal of
Finance, 42, 1439-1466.
8. Teoh, Siew Hong, Ivo Welch, and T.J. Wong, 1998, "Earnings Management and the
Underperformance of Seasoned Equity Offerings," Journal of Financial Economics,
50, 63-99.
VIII. Corporate Control and Corporate Governance
1. RWJ Chapter 30 (or BM Chapter 33)
☆ 2. Shleifer, Andrei, and Robert Vishny, 1986, "Large Shareholders and Corporate
Control," Journal of Political Economy, 94, 461-488.
☆ 3. Shleifer, Andrei, and Robert Vishny, 1997, "A Survey of Corporate Governance,"
Journal of Finance, 52, 737-783.
Corporate Finance Seminar I National Taiwan University
Fall, 2001 Konan Chan
6
★ 4. Loughran, Tim, and Anand M. Vijh, 1997, "Do Long-Term Shareholders Benefit From
Corporate Acquisitions," Journal of Finance, 52, 1765-1790.
5. Grossman, Sanford, and Oliver D. Hart, 1980, "Takeover Bids, the Free Rider Problem,
and the Theory of the Corporation," Bell Journal of Economics, 11, 42-64.
6. Jensen, Michael C., and Richard S. Ruback, 1983, "The Market for Corporate Control:
The Scientific Evidence," Journal of Financial Economics, 11, 5-50.
7. Jensen, Michael C., and Kevin J. Murphy, 1990, "Performance Pay and Top
Management Incentives: Historical Evidence," Journal of Political Economy, 98,
225-264.
8. Weisbach, Michael, 1988, "Outside Directors and CEO Turnover," Journal of
Financial Economics, 20, 431-460.
△ 9. Weisbach, Michael, 1995, "CEO Turnover and the Firm’s Investment Decisions,"
Journal of Financial Economics, 37, 159-188.
10. Morck, Randall, Andrei Shleifer, and Robert Vishny, 1988, "Management Ownership
and Market Valuation: An Empirical Analysis," Journal of Financial Economics, 20,
293-315.
IX. Financial Distress and Restructuring
☆ 1. Senbet, Lemma, and James Seward, 1995, "Financial Distress, Bankruptcy and
reorganization," Chapter 26 in Jarrow, Maksimovic and Ziemba ed.: Handbooks in
Operations Research and Management Science, Vol 9.
☆ 2. Gertner, Robert, and David Sharfstein, 1991, "A Theory of Workouts and the Effects of
Reorganization Law," Journal of Finance, 46, 1189-1222.
★ 3. Andrade, Gregor, and Steven Kaplan, 1998, "How Costly Is Financial (Not Economic)
Distress? Evidence from Highly Leveraged Transactions That Became Distressed,"
Journal of Finance, 53, 1443-1493.
△ 4. Pulvino, Todd C., 1998, "Do Asset Fire Sales Exist? An Empirical Investigation of
Commercial Aircraft Transactions," Journal of Finance, 53, 939-978.
5. Opler, Tim C., and Sheridan Titman, 1994, "Financial Distress and Corporate
Performance," Journal of Finance, 49, 1015-1040.
X. Event Study Issues
☆ 1. Campbell, John Y., Andrew W. Lo, and A. Craig Mackinlay, 1997, The Econometrics
of Financial Markets, Chapter 4.
★ 2. Loughran, Tim, and Jay R. Ritter, 2000, "Uniformly Least Powerful Tests of Market
Efficiency," Journal of Financial Economics, 55, 361-389.
Corporate Finance Seminar I National Taiwan University
Fall, 2001 Konan Chan
7
★ 3. Lyon, John D, Brad M. Barber, and Chih-ling Tsai, 1999, "Improved Methods for Tests
of Long-Run Abnormal Stock Returns," Journal of Finance, 54, 165-201.
4. Brown, Stephen J., and Jerold B. Warner, 1985, "Using Daily Stock Returns: The Case
of Event Studies," Journal of Financial Economics, 14, 3-31.
5. Barber, Brad M., and Lyon, John D, 1996, "Detecting Long-Run Abnormal Stock
Returns: The Empirical Power and Specification of Test-Statistics," Journal of
Financial Economics, 41, 359-399.
6. Fama, Eugene, 1998, "Market Efficiency, Long-Term Returns, and Behavioral
Finance," Journal of Financial Economics, 49, 283-306.
XI. Others
☆ 1. Anderson, Ronald W., and Suresh Sundaresan, 1996, "Design and Valuation of Debt
Contracts," Review of Financial Studies, 9, 37-68.
★ 2. La Porta, Rafael, Florencio Lopez-de-Silanes, and Andrei Shleifer, 1999, "Corporate
Ownership Around the World," Journal of Finance, 54, 471-517.
★ 3. La Porta, Rafael, Florencio Lopez-de-Silanes, Andrei Shleifer, and Robert Vishny,
2000, "Investor Protection and Corporate Governance," Journal of Financial
Economics, 58, 3-27.
★ 4. Chance, Don M., Raman Kumar, and Rebecca B. Todd, 2000, "The ‘Repricing’ of
Executive Stock Options," Journal of Financial Economics, 57, 129-154.
Wednesday, January 25, 2006
Interpreting the Pre-emptive move of RBI
Is inflation really a cause of worry? May be yes if the oil prices continue to rise. Reading articles on the RBI’s move to increase the reverse repo rate, I am confused. I will better rely on what theory says and try to interpret whether increasing rates make sense.
The issue of increasing the interest rates is related to demand and supply of money. Supply of money is to be understood with the liquidity aspect associated with it. What factors have driven the demand for money in the Indian economy? As per the RBI statistics the non-food credit adjusted for non-SLR investments recorded a year-on-year growth of 28.3% on Jan.06, 2006 as compared with 27.9% a year ago. The demand for credit increases when the firms are making investments in capacity expansion to meet the increased demand for products. As the demand for credit increases, theoretically speaking, the interest rates would rise. As the cost of funds for the commercial sector increases they would be prompted to delay their investment plans or explore other sources for meeting their demand for credit.
Before going further it is imperative to understand the various fund raising options the commercial sector has in India. The table below shows the select sources of funds to industry.
.1.jpg)
The issue of increasing the interest rates is related to demand and supply of money. Supply of money is to be understood with the liquidity aspect associated with it. What factors have driven the demand for money in the Indian economy? As per the RBI statistics the non-food credit adjusted for non-SLR investments recorded a year-on-year growth of 28.3% on Jan.06, 2006 as compared with 27.9% a year ago. The demand for credit increases when the firms are making investments in capacity expansion to meet the increased demand for products. As the demand for credit increases, theoretically speaking, the interest rates would rise. As the cost of funds for the commercial sector increases they would be prompted to delay their investment plans or explore other sources for meeting their demand for credit.
Before going further it is imperative to understand the various fund raising options the commercial sector has in India. The table below shows the select sources of funds to industry.
 Source: Reserve Bank of India report
Observing the table the ratio of bank credit to non-bank credit has been 61% in Q2, 2005 compared to 41% in Q2, 2004. Funds raised from equity markets increased to Rs. 5,397 crores in Q3 from Rs.4,977 crores in Q2. The other sources for raising funds have been from issuances of ADRs/GDRs and ECBs. However, not all firms have the access and capacity to raise funds from external sources and equity markets and hence the increasing demand on banks to provide the credit. With the limitation of the source of funds and limited funds at the disposal of the banks, the pressure is on interest rates is bound to increase.
The data released also shows that Commercial Banks’ holding of government securities was 31% of their net demand and time liabilities compared to 36% in last quarter and 39% a year ago. The minimum is 25%, so no issues on this front. However, on the flip side this may put pressure on the auctions of the G-securities hence raising the cost of government borrowings. This is where the problem is. Government uses these funds to meet its investment commitments and non-planned expenditures. With the yields on the G-secs across the maturity increasing the yield curve tends to shift upwards.
With the banks having a higher return by lending to the commercial sector at least a min. spread of 3-4%, they would continue to do so. The sources of funds for banks are borrowings from other banks, RBI and demand and time liabilities in addition to tapping the capital markets both debt and equity. To address the increased demand for the credit, banks may raise the demand and time deposit rates. RBI with its several tools like LAF and MSS attempts to minimize the mismatch in the demand and supply in the short-run. Many banks of late have also raised funds from the equity markets.
Coming to the supply side, bank rate (6% unchanged in current quarterly review) by definition represents the cost of funds for the banks borrowing from the RBI. No increases in SLR and CRR, very rightly, these are not to be changed frequently as these have long-term repercussions on the economy. With the commercial sector primarily relying on bank credit the prime responsibility of the banks and financial institutions is to transfer the funds from the surplus sectors of the economy to the deficit sectors. So the next logical step is to identify the sectors having surplus funds. Given the increased economic activity it is very less likely that the surplus sectors would be easy to identify. Consumer spending is increasing and hence the increased manufacturing activity.
Adding to complexity is rising oil prices. With Oil imports (in quantity) set to increase with increased economic activity coupled with increasing prices would widen the current account deficit. As this happens the central bank uses its reserves to meet its demand for the foreign currency. Hence, rupee depreciates. While depreciating domestic currency increases the realizations from exports this may not offset the demand for imports. In my view current account deficit is a must for the developing country like us provided the imports are productive assets. While debate with regards to the current account deficit continues one has to keep in mind that oil prices are an extraneous variable. Given the volatility in the oil prices expected to continue what options did RBI have? With oil price expected to increase, the inflation is expected to increase and hence its impact on consumer confidence and spending subsequently. No one with confidence can say how and when the equilibrium would be restored.
So what purpose does increasing the repo and reverse repo rate solve? Repo stands for repurchase obligation is a money market instrument, which enables collateralized short term borrowing and lending through sale/purchase operations in debt instruments. In a typical repo transaction, the counter-parties agree to exchange securities and cash, with a simultaneous agreement to reverse the transactions after a given period. So in our case the banks borrow cash to meet their short-term liquidity requirements by selling their holdings of the G-secs to the central bank. From the central bank perspective this is lending of cash against collateralized asset. If the central bank increases this rate as happened in the current quarterly review it signals that central bank is facing liquidity constraints on its part to lend cash further. The increase in rates can be interpreted to discourage excessive lending of cash and or signal increasing cost of executing such a transaction.
I think RBI is right on saying that is only to pre-empt any inflationary pressures.
Saturday, January 21, 2006
Way to do away with Fringe Benefit Tax (FBT)
This is a time when most of us are trying to get the tax planning in place, specially the young lot who are in their first year of employment.
One of the options of doing away with the fringe benefit tax is to work full time as an employee but to be shown as consultant in the records. In such a scenario only TDS would be deducted by the employer and rest is all yours.
All expenditures incurred to execute the service to the employer can be shown as business expenses. Finally the net income is taxable (Iam excluding all other exemptions that may be permitted under the Income Tax Act).
Is this ethical? I personally do not endorse this idea.
Friday, January 20, 2006
Quarterly Review of RBI scheduled on Jan. 24, 2006
Given the state of inflation and interest rates, it is very less likely that RBI would be signaling any increase in interest rates. However, with the rising consumer confidence and increase in capital expenditures across the industries signals that the credit off-take would continue to increase and may exert an upward pressure on interest rates.
Implications of an increase in current account deficit are yet to be fully understood. I recall an article that I read in Economic Times sometime in December 2005. I personally feel that the deficit is not a concern now, but this needs to be linked to the oil prices and FII inflows. Would be keeping a close watch on this over the next a couple of quarters.
For more on this read “RBI Quarterly Review No Sparks expected” published in Business Line on Jan.10, 2006.
How to Read a Balance Sheet?
Balance sheet is a snapshot of what a firm owns and what it owes. What the firm owns is reflected under the heading ‘Assets’ and what it owes under ‘Liabilities. The basic format used for all balance sheets is showing all the assets on one side and liabilities on the other side. It is called balance sheet because it balances:
Assets – Liabilities = Equity
Assets are broadly classified as fixed assets and current assets. Liabilities are classified into debt and equity. Debt can be further classified as long-term debt and current liabilities. While assets represent investments in the business, liabilities reflect the sources of financing. Proportion of liabilities and equity financing the investments have a significant impact on the return on investment.
Analysis of balance sheet helps assess the liquidity, return on investment (ROI) and leverage of a firm. Liquidity refers to the ability of the firm to pay its bills when due. Ideally, the current liabilities – payments to be made to firm’s suppliers and other day-to-day operating costs – should match the inflows of current assets; primarily arising from the credit sales. However, this is a rare possibility in practice for obvious reasons.
Readily realizable assets the firm has on hand, after paying its current liabilities is a measure of the liquidity of the firm. Current assets divided by current liabilities called, as current ratio is one such indicator computed using the information from the balance sheet and used in assessing the liquidity of the firm.
While the suppliers of the firm would always favor higher ratio, it indicates that firm is not using its liquidity to grow. In other words, firm with higher current ratio would have investments in assets which are not the primary revenue-earning assets. The other key aspect to be observed, in addition to the current ratio, is the composition of current assets. Cash - considered to be the most liquid of all assets - is what percent of the total current assets? While higher amount of cash is always better, excess of it indicates unproductive use. Days the credit sales are outstanding and firm’s ability to collect them on time are also some of the other indicators to be looked into before interpreting the current assets. Finally, the computed current ratio should be compared against the firm’s nearest competitor or industry average and also with its own previous years’ values.
ROI measures the returns the firm provides to its investors i.e. shareholders. It is computed by dividing the Net Income by shareholders’ equity.
For instance, an ROI of 10% indicates that for every 100 units of investment, investors get 10 units of returns. However, ROI would vary owing to firm and industry characteristics. Shareholders’ equity is observable from the balance sheet; Net Income is taken from the income statement.
Leverage - a measure of how a firm’s assets are financed- is computed by dividing debt (usually only long-term debt is taken into consideration for the computation of leverage ratio) by shareholder’s equity.
The level of debt a firm has on its balance sheet is a crude indicator of the bankruptcy risk the firm is likely to face. Higher the leverage number, the more risky the firm’s position is. This is so because debt involves interest payments that cannot be delayed. At higher debt levels firm should earn enough profits to honor interests payments when due. While it is not rare to find firms with no debt, some level of debt is always preferable given the tax bias against equity. However, there exists no universal theory that provides clear answer to what is an optimal ratio despite four decades of empirical and academic research. Observing the leverage ratio across industries one would find it varying from 0 to 1.2 or even higher. A useful comparison for the sake of analysis would be an industry average or nearest competitor (in the same line of business).
Balance sheet is a key part of a firm’s financial statements but does not provide a complete picture of the firm. The complete picture emerges only after looking into income statement, cash flow statement and management’s discussion & analysis including balance sheet. Though a valuable source of information, informed investment decisions could be taken only after supplementing the information in balance sheet with analysis of other financial statements. In the next article we would discuss the utility of financial ratios as tools of analysis.
Consumer Electronics Market in India
Sectoral Analysis – Consumer Electronics
The consumer electronics market consists of the total revenues generated through the sale of video, audio and games consoles. The video sector consists of televisions, video recorders (VCRs), DVD players/recorders, integrated television recorders, camcorders, digital cameras, set top boxes. The audio sector consists of audio home systems, CD-players/recorders, minidisks, radios, portable audio systems (MP3 players, minidisc players, CD players, personal stereo, and radios). Games consoles consist of all hand-held and plug-in consoles.
Global consumer electronics industry grew by 6.6% in 2004 to reach a value of $156.2 billion in 2004. As per the Datamonitor report Global consumer electronics market grew at a CAGR of 4.6% in 2000-04.
Chart 1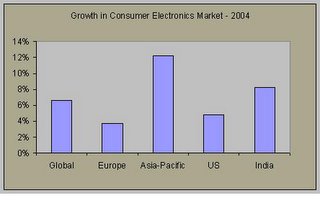
Global consumer electronics industry grew by 6.6% in 2004 to reach a value of $156.2 billion in 2004. As per the Datamonitor report Global consumer electronics market grew at a CAGR of 4.6% in 2000-04.
Chart 1
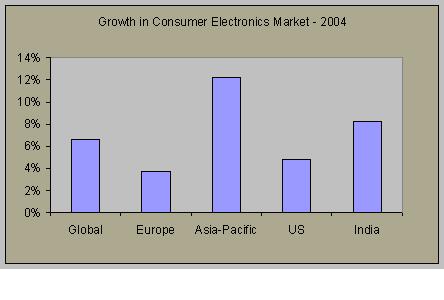
Source: Datamonitor Report (July 2005)
Indian consumer electronic market recovered in 2002-03. The market reached a value of Rs.129.5 billion in 2003 a growth of 12.4% over the previous year. In 2004 continuing the trend the market grew to Rs.154 billion approximately. Rising income levels, easy availability of consumer finance and declining prices of consumer electronics primarily drove growth. Decline in prices primarily being led by reduction in excise and custom duties and increased competition.
Chart 2
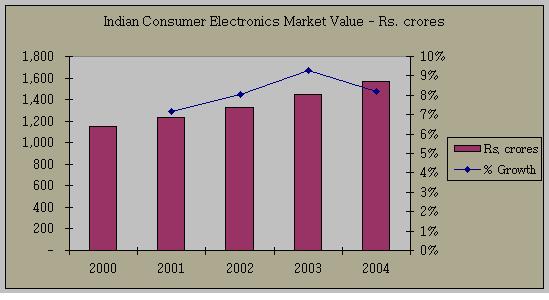
Source: Datamonitor Report (July 2005)
The second half of 1990s saw the first bunch of global brands like Akai, Aiwa, Sansui and Toshiba through strategic tie-ups with the established Indian players.
The second half of 1990s saw the first bunch of global brands like Akai, Aiwa, Sansui and Toshiba through strategic tie-ups with the established Indian players.
The other multinationals like Sony, LG, and Samsung entered on their own and quickly captured the imagination of the market with innovations in product quality and features. In order to gain market share the players invested heavily on marketing strategies and product innovations. As a result the sales realizations declined from 1999-2000. However, since then the focus of the players has been on creating differentiation through product innovations and aesthetic appeal.
With product innovations emerging as the key driver of growth, global players have invested significantly R&D. While product innovation is narrowing the margins it is contributing to growth in sales. A similar trend is being witnessed in Indian consumer electronics industry. Despite the low penetration the declining prices (primarily led by the reduction in excise and custom duties) of the consumer electronics have enticed the consumers to opt for products with better technology and attributes. For instance the sales of flat color televisions (CTVs) in 2004 accounted for 30% of the industry’s total sales, a growth of 120% over 003. This trend started in 2001 when price reductions as a marketing strategy took a back seat with players trying to differentiate premium models that were both technologically and aesthetically superior.
Rising raw material costs and energy costs has impacted the margins of the global consumer electronics industry. Plastic is a substantial input for the industry constituting 30% of the cost. The price of plastic has gone up considerably in the global market. However, reduction in custom duty on plastic to 10% in 2005-06 will help lower the plastic cost for the Indian manufacturers. Customs duty on color picture tubes and color and B/W TVs is reduced from 20.4% in 2004-05 to 15.3% in 2005-06. Current excise duty on color picture tubes is 16.3%.
Major Players – Consumer Electronics Industry (India)
Videocon International has a strong presence in the Indian market. The other key players in Indian consumer electronics market are LG Electronics, Samsung and MIRC Electronics. Videocon has recently acquired Thomson’s TV tube manufacturing business to become the only Indian manufacturer of these vital components. The domestic company BPL recently formed a partnership with Sanyo in the color TV sector. One reason for the current dominance of local players is India’s tariffs on imports. However, free trade agreements with Thailand and other Asian countries will be coming into force in the next few years. This liberalization will doubtless benefit those companies from China and elsewhere that are able to supply cheap imports.
Growth Prospects
50-75 million middle class Indians constitute who form the realistic consumer base of consumer electronics market is the key driver of demand for the industry. With Indian economy showing a robust growth, average monsoon, and lower inflation despite fuel price hikes is likely to result in increased spending on consumer electronics in 2005. In recent years the penetration level of the industry has increased in the rural markets especially for CTVs. This is expected to continue further.
Given the fact that consumer electronics is very price sensitive, reduction in prices by the players in the past have lead to increase in demand. Pricing of a product largely depends upon the cost of input, distribution, marketing and general industry scenario in the light of the competition. With inflationary rise of costs of input and increased marketing spend the margins for the industry would be under pressure. The demand for consumer electronics in India is also driven by sporting events like cricket world cup. Chart 2 shows the growth of the consumer electronics market in India. The spike in growth rate in 2003 was mainly due to the cricket world cup. With no such event in 2004, the growth rate dipped. As per Datamonitor forecasts the consumer electronics market is expected to grow at a CAGR of 7.7% for the five-year period 2004-2009.
The dominance of the local players in Indian consumer electronics would be challenged in few years when the free trade agreements with Asian countries comes into effect. Currently due to higher import tariffs the local players are enjoying a cost advantage. Cheap imports from these countries would definitely impact the cost structures of the local players. Additionally, the aggressive marketing and price wars by the multinational companies are the major risks for the domestic companies. This would entail the component suppliers to bring in their costs down. For instance in case of color picture tubes (CPTs) domestic production increased from 9 million units in 2003 to 12 million units in 2004. However, the sales value per unit of production declined from 18% in 2003 to 13% in 2004. Given the present scenario this is expected to fall further. Similar trend is being noticed for audio equipment also . With dominance of local players being challenged in the industry the local component suppliers may have to rethink their future course of action.
Subscribe to:
Posts (Atom)